Bitcoin’s next price target ahead of ‘aggressive non-stop rally’
Bitcoin (BTC) is navigating the post-halving phase, facing resistance below the last all-time high. As the crypto continues to find its footing, a section of the market believes that Bitcoin is in line to embark on a post-halving rally, an element backed by several analysts.
For instance, crypto trading expert TradingShot acknowledged in a TradingView post on April 22 that Bitcoin is at a critical juncture, struggling to surpass and sustainably close above its record-high resistance.
According to the analyst, the pattern has been marked by a period of sideways consolidation, and while it might suggest bearish sentiments, history suggests otherwise.
Picks for you
TradingShot’s analysis noted that within Bitcoin’s historical cycles, such periods of consolidation often precede an aggressive non-stop rally, propelling the cryptocurrency to new heights. Therefore, the expert noted that Bitcoin will likely peak at $150,000 to $300,000 if the pattern repeats.
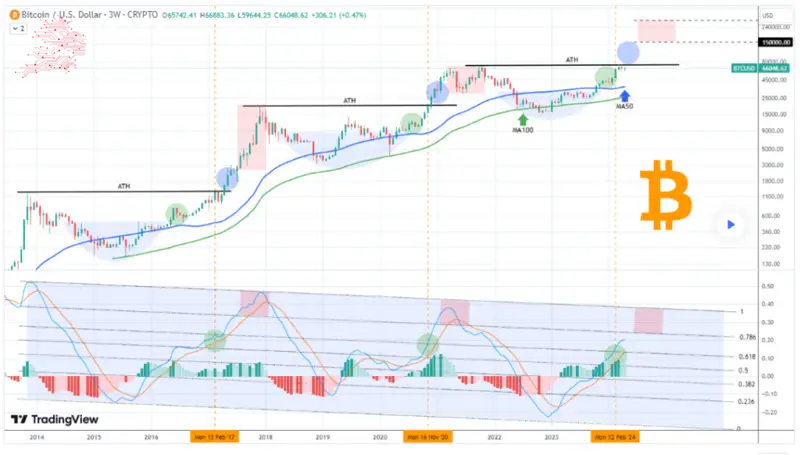
“On any other occasion, that would be a bearish signal, an inability of the market to find enough willing buyers to push it to a new High. But with BTC’s historic cycles this has proved to be just a stepping stone before the most aggressive phase, the non-stop rally that drives the Cycle to its peak. (…) We estimate this to take place within the (admittedly) wide range of $150,000 – $300,000, depending on market conditions and relevant global demand from ETFs,” the expert said.
Indicators to watch
Based on the analysis, the key indicator signaling the potential rally is the three-week Linear Moving Average Convergence Divergence (LMACD).
The expert noted that the indicator, trading within a channel-down pattern from the outset, tends to reach a critical juncture when it hits the 0.618 Fibonacci channel level. At this point, Bitcoin has historically closed above its record high and embarked on a robust rally.
Furthermore, the Analysis suggested that the formation of a peak characterizes the final phase of this cycle. This occurs as the LMACD approaches the channel’s upper boundary and reverses, often preceding a bearish cross.
Bitcoin price analysis
By press time, Bitcoin was trading at $66,283 with daily gains of almost 0.4%. On the weekly chart, BTC is up 5%.
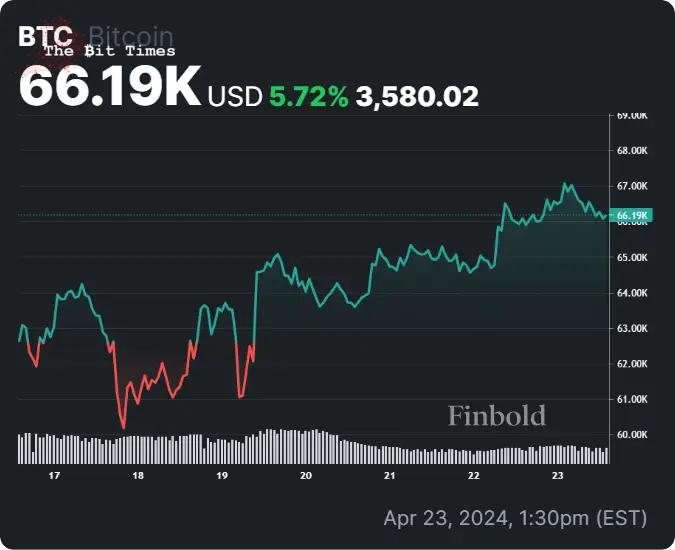
Overall, the current Bitcoin price movement shows the cryptocurrency’s resilience after shrugging off the fallout from geopolitical tensions. Indeed, Bitcoin is establishing itself above the $65,000 mark amid a possible cooling down of tensions in the Middle East.
The $65,000 mark remains pivotal for market participants, as it will play a key role if the analyst’s projections are to be realized.
Disclaimer: The content on this site should not be considered investment advice. Investing is speculative. When investing, your capital is at risk.


Comments
Post a Comment